
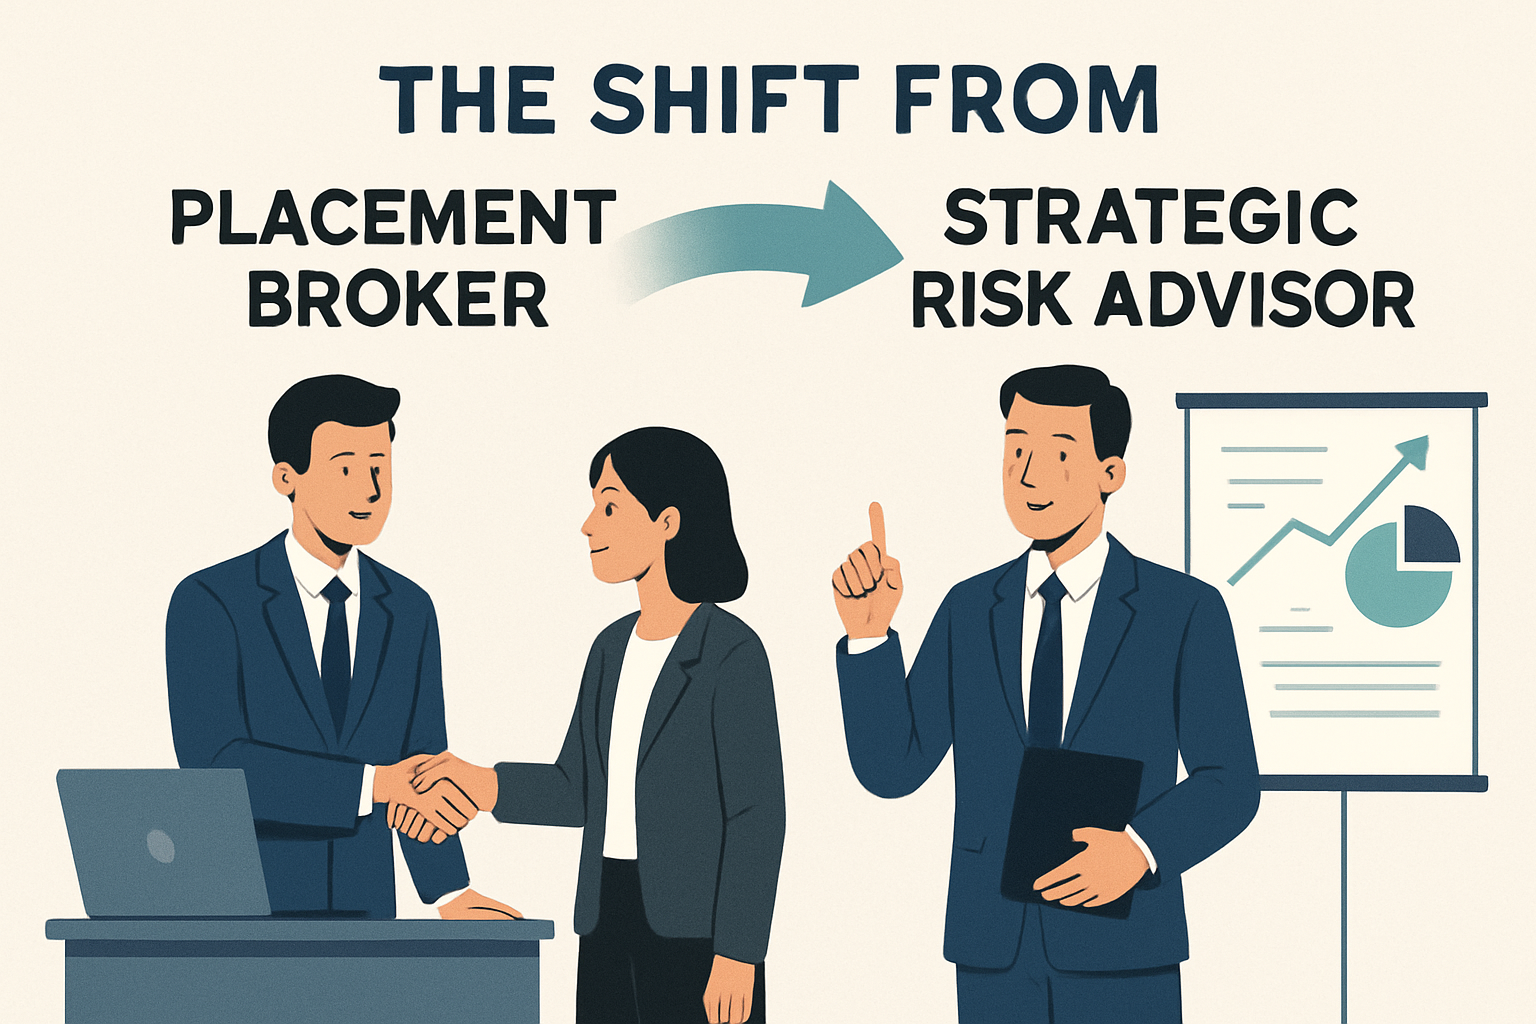
The Shift From Placement Broker to Strategic Risk Advisor
The insurance brokerage industry is evolving.
Benefits brokers, workers’ comp brokers, and health insurance advisors are no longer competing solely on pricing, plan design, or carrier relationships. Clients now expect measurable insight — not just policy placement.
Client retention is driven by relevance.
And relevance today is powered by HR metrics and workforce analytics.
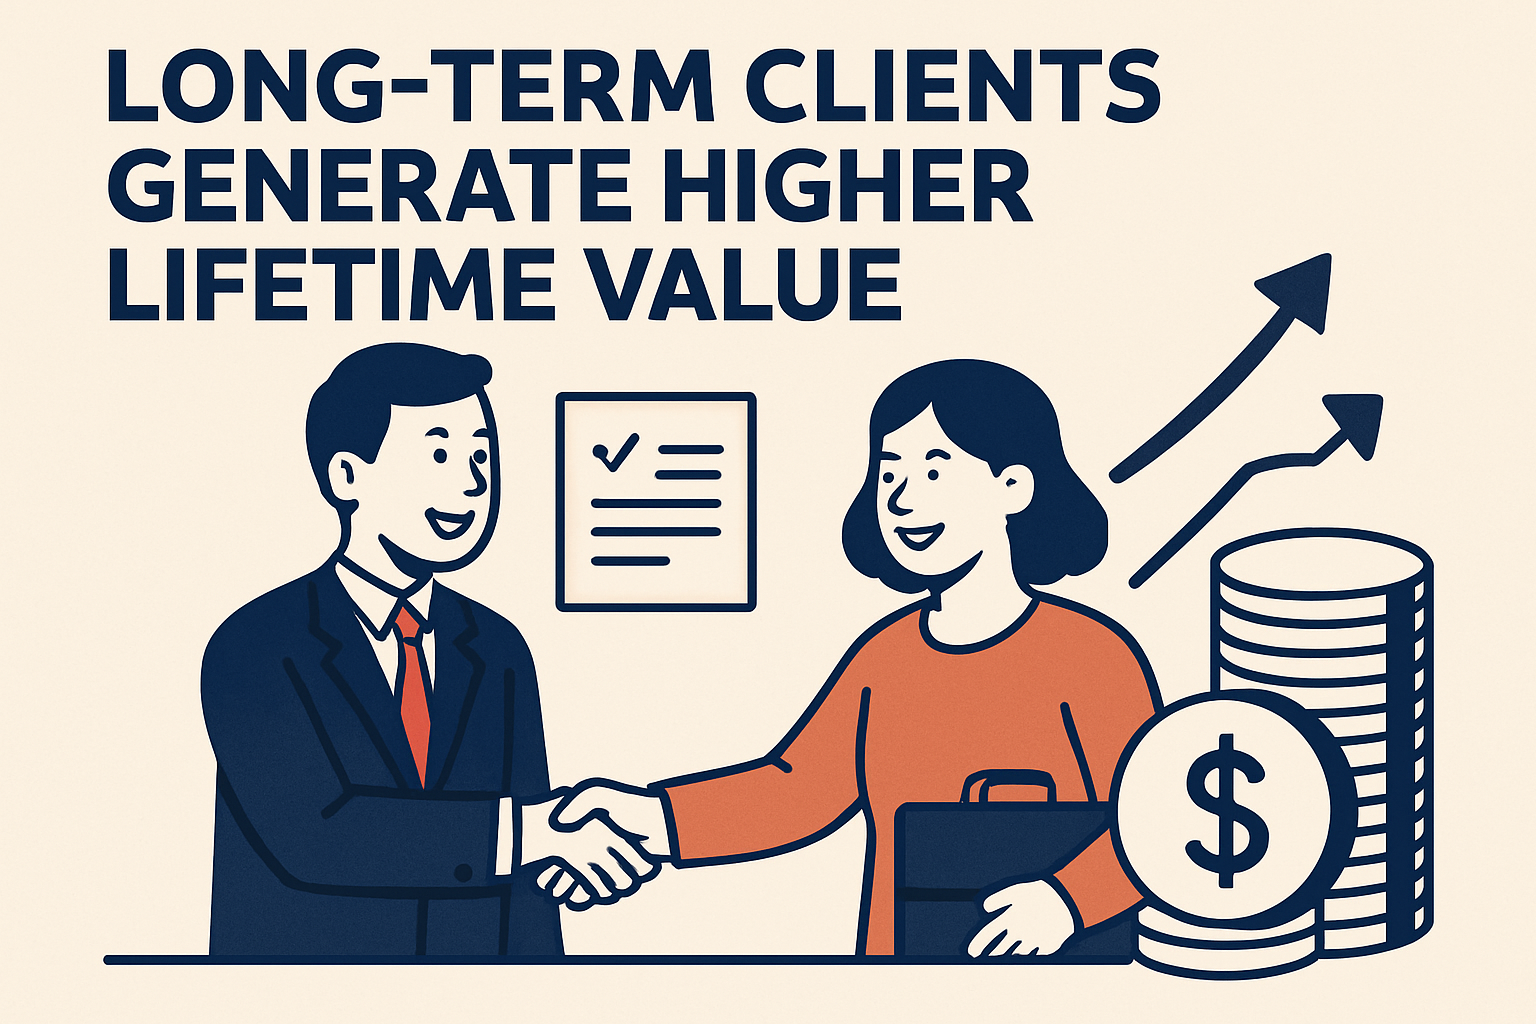
According to research from Harvard Business Review, retaining existing customers is significantly more cost-effective than acquiring new ones. Brokers who focus on retention build stronger lifetime value.
Retention is driven by relevance.
And relevance today is powered by HR metrics and workforce analytics.
Brokers who integrate HR data into their advisory model:
- Anticipate risk before it becomes costly
- Demonstrate measurable ROI
- Strengthen executive relationships
- Increase switching costs
- Improve multi-year client retention
This article breaks down how to operationalize HR analytics inside your brokerage model.
Why HR Metrics Are Now a Broker Retention Strategy
Insurance premiums are influenced by workforce behavior.
Turnover, absenteeism, injury rates, chronic health conditions, and engagement levels all directly impact insurance cost structures.
The U.S. Bureau of Labor Statistics Job Openings & Labor Turnover Survey (JOLTS) provides updated workforce turnover benchmarks brokers can reference:
Most brokerage growth strategies emphasize acquisition. But data consistently shows:
- Retaining clients costs significantly less than acquiring new ones.
- Long-term clients generate higher lifetime value.
- Renewal relationships are more profitable.
- Cross-sell and upsell opportunities increase over time.
Yet many brokers lose accounts not because of pricing — but because clients perceive limited strategic value.
When brokers show up once a year for renewal, they are seen as transactional.
When brokers deliver quarterly workforce insights, many are supported by structured HR advisory models they are seen as partners.
HR analytics transforms the broker-client relationship from reactive to consultative.
The Core HR Metrics Brokers Should Be Tracking
Not all HR data matters equally. The key is connecting workforce metrics to financial and insurance impact.
Let’s break this down strategically.
1. Employee Turnover & Retention Metrics
Why It Matters for Brokers
High turnover impacts:
- Health insurance enrollment patterns
- Claims volatility
- Workers’ comp exposure
- Training costs
- Productivity loss
- Organizational stability
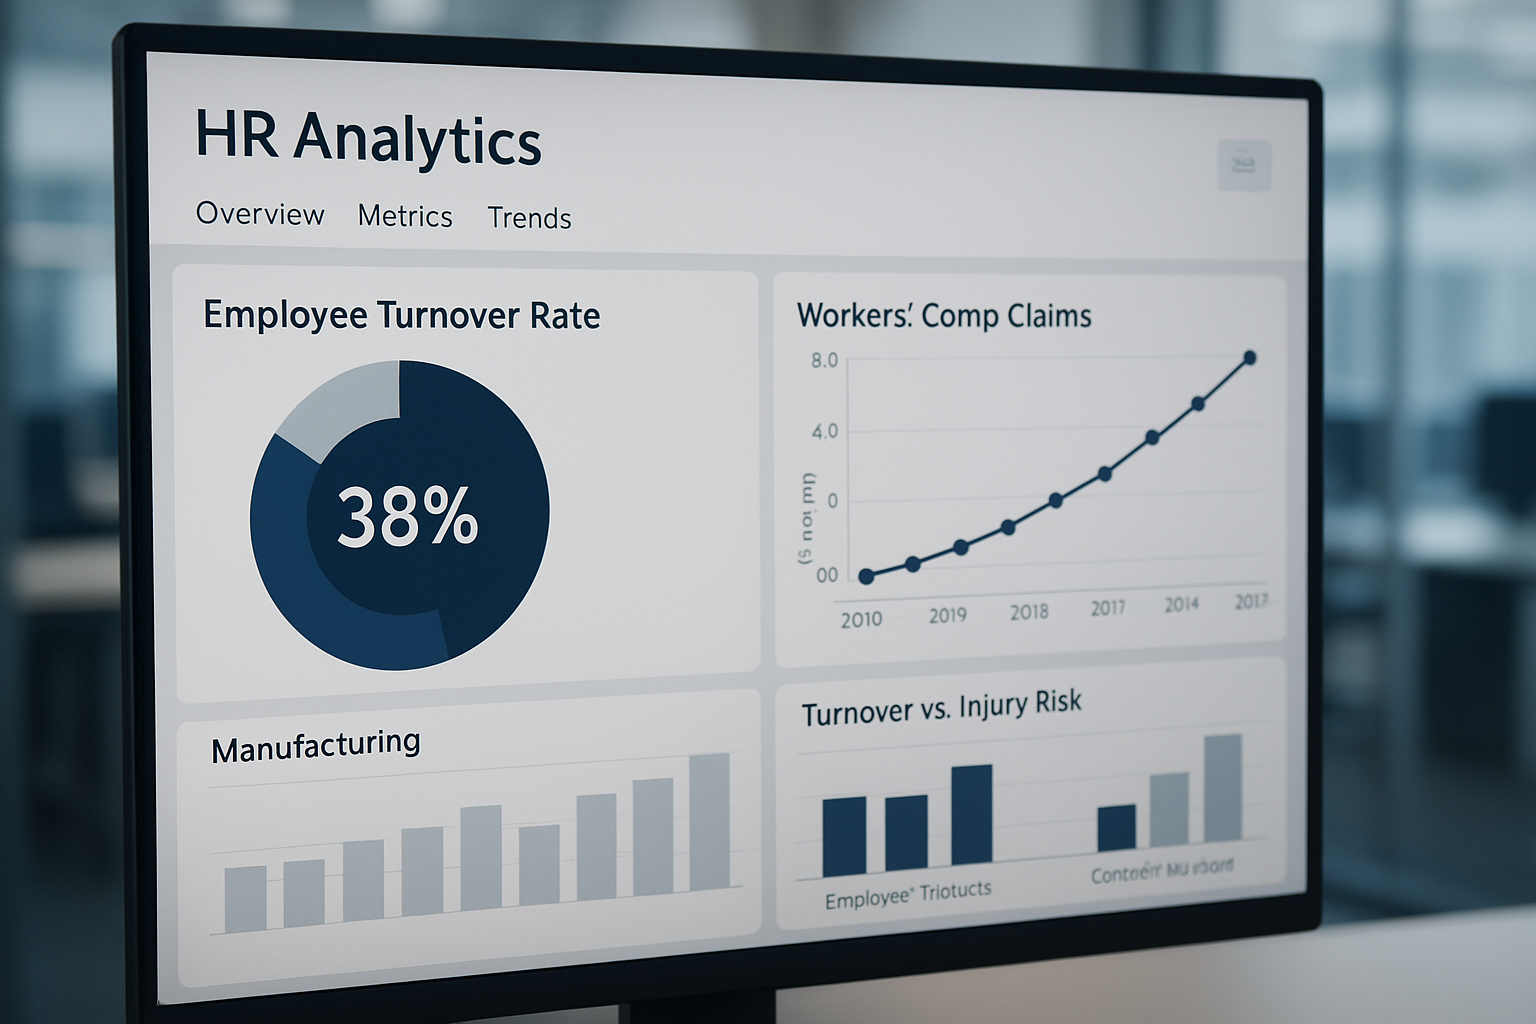
For example:
If a manufacturing client has a 38% annual turnover rate, injury rates and comp claims are likely higher due to inexperienced employees.
When brokers connect turnover data to claims frequency, they elevate the conversation beyond policy pricing.
How to Use It Strategically
- Show turnover trends over 12–24 months
- Benchmark against industry averages
- Link turnover to claims patterns
- Recommend retention-focused HR initiatives
- Position workforce stability as a risk mitigation tool
This moves the broker into strategic advisory territory.
2. Absenteeism & Leave Trends
Absenteeism is often an early warning signal.
It may indicate:
- Safety issues
- Workplace culture problems
- Burnout
- Chronic health conditions
- Engagement decline
For workers’ comp brokers, this is especially powerful.
Frequent short-term absences can precede injury claims. Patterns of Monday/Friday absences may indicate operational strain.
Strategic Implementation
Instead of discussing loss ratios only, present:
- Monthly absence trends
- Department-level patterns
- Correlations with claims spikes
- Risk heat maps
This type of analysis shifts the broker from policy vendor to operational risk consultant.
3. Claims Utilization & Cost Drivers
Every broker reviews claims.
Few brokers analyze claims strategically.
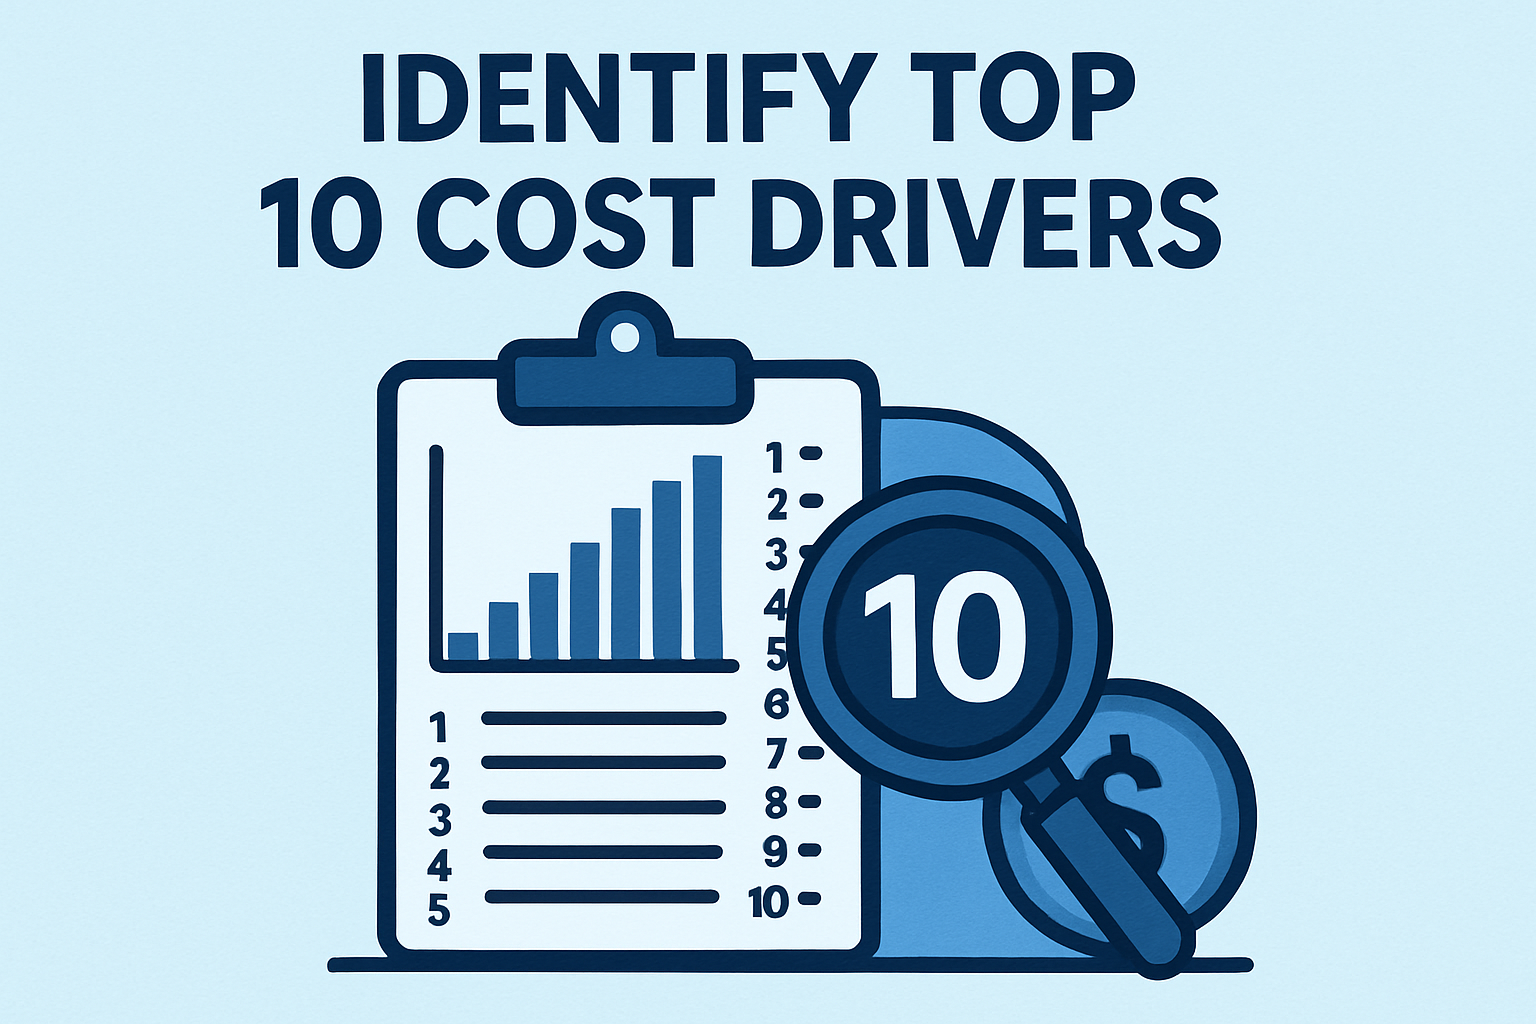
Instead of simply reporting total claims spend, advanced brokers:
- Identify top 10 cost drivers
- Segment claims by age group
- Analyze chronic condition prevalence
- Evaluate preventive care gaps
- Assess high-cost claimant trends
For example:
If diabetes-related claims are rising 18% year-over-year, the broker can recommend targeted wellness initiatives or plan design adjustments.
This shows proactive cost control — not reactive renewal negotiation.
4. Workforce Demographics & Risk Exposure
Demographic data affects:
- Healthcare utilization
- Safety risk levels
- Maternity claims
- Chronic disease probability
- Retirement transitions
Brokers who analyze workforce age bands and role types can forecast insurance cost trends before renewal season.
Example:
An aging workforce may require adjusted safety training, ergonomic initiatives, or plan design changes.
When brokers present this analysis proactively, CFOs listen.
5. Compensation & Pay Equity Data
Pay inequity correlates strongly with:
- Attrition
- Legal exposure
- Engagement decline
- Litigation risk
While brokers may not own compensation strategy, they can surface patterns that indicate organizational instability.
A stable workforce = predictable risk = controlled insurance costs.
When brokers understand this connection, they strengthen their advisory credibility.
How HR Analytics Directly Increases Client Retention
Now let’s connect metrics to retention strategy.
1. It Increases Executive Visibility
Data-based reporting gets you into:
- CFO meetings
- Executive planning sessions
- Board discussions
Renewal conversations move from “what’s the rate increase?” to “what are our workforce risk trends?”
That is strategic positioning.
2. It Makes You Harder to Replace
If your brokerage provides:
- Quarterly HR risk dashboards
- Industry benchmarking
- Workforce forecasting
- Predictive claims analysis
Replacing you means losing institutional insight.
That dramatically increases switching friction.
3. It Strengthens Renewal Negotiations

When you can show:
- Claims reduction trends
- Improved absence metrics
- Safety program ROI
- Turnover stabilization
You negotiate from a position of authority.
Carriers respect data-driven brokers.
Clients retain brokers who demonstrate control.
4. It Aligns You With HR & Finance
Many brokers align only with HR.
Advanced brokers align with:
- HR
- Finance
- Operations
- Safety leadership

How Brokers Can Operationalize HR Analytics
Step 1: Establish Baseline Workforce Metrics
Collect:
- Turnover
- Absenteeism
- Claims trends
- Demographics
- Compensation ranges
Step 2: Build a Quarterly Workforce Risk Report
Include:
- Trend charts
- Risk indicators
- Benchmark comparisons
- Strategic recommendations
Step 3: Link Every Metric to Financial Impact
Translate:
- Turnover → claims exposure
- Absenteeism → productivity cost
- Demographics → plan utilization
- Engagement → retention risk
Executives care about dollars, not dashboards.
Step 4: Create Recurring Advisory Meetings
Quarterly strategic sessions improve:
- Engagement
- Visibility
- Retention probability
The Competitive Advantage: Data-Driven Brokerage
In the next five years:
Transactional brokers will compete on price.
Data-driven brokers will compete on strategy.
Strategy wins retention.
And retention drives profitability.
Key Takeaways
- HR metrics strengthen broker-client retention.
- Workforce analytics elevates renewal conversations.
- Data-driven brokers become strategic advisors.
- Quarterly reporting increases switching costs.
- HR analytics reduces churn risk.
FAQ
1. Does high employee turnover increase workers’ compensation claims?
Yes. High turnover often increases workers’ compensation claims because new or less-tenured employees are more likely to experience training gaps, inconsistent safety compliance, and operational disruption. In industries like manufacturing and construction, injury rates frequently correlate with tenure length.
2. What turnover rate is considered high risk for insurance exposure?
Turnover above 25–30% annually in safety-sensitive industries is typically considered elevated risk. However, risk depends on role type, training intensity, and claims history.
3. How can brokers measure turnover-related insurance risk?
Brokers can track turnover alongside claims frequency, injury severity, and tenure-based incident reports. Correlating these data sets helps identify whether workforce churn is increasing exposure.
4. Why do inexperienced employees drive higher comp costs?
Inexperienced employees may lack safety familiarity, operational confidence, and compliance knowledge, which increases injury probability and claims severity.
5. Can absenteeism predict workers’ comp claims?
Yes. Elevated absenteeism may signal safety concerns, burnout, or workplace instability that precedes injury incidents.
6. What absenteeism patterns should brokers monitor?
Brokers should monitor:
- Department-specific spikes
- Repeated short-term absences
- Monday/Friday patterns
- Pre-incident absence clusters
7. How does absenteeism affect insurance costs?
Absenteeism impacts productivity and can correlate with higher healthcare utilization, injury frequency, and replacement labor costs.
8. What is the difference between voluntary absence and injury-related absence?
Voluntary absence is employee-driven and not claim-related, while injury-related absence stems from workplace incidents and often triggers workers’ compensation claims.